Putting traffic lights showing either red, yellow or green is an important feature for creating many kinds of slides, e.g. flash reports. Something like this can be done with SlideFab 2 easily. Watch the video to learn it.
So far, it was required to use the Make Slides window within SlideFab 2 to automatically create the PowerPoint slides based on Excel. This works fine. But for a deeper integration of SlideFab 2 into your own applications some API functionality was missing… until now. The slide mass creation can be invoked through the SlideFab 2 API using a few lines of code. It is pretty simple to use and offers a whole new world of opportunities for all those who enjoy coding VBA.
This new version is available at the download page or updated automatically from your existing SlideFab 2 installation
SlideFab 2 v1.8 is available now. It brings a couple of logical improvements to the Slide Loops feature. This feature can be used as an alternative or an enrichment to the overall iteration when creating multiple copies of a given slide. Of course, this new version is also available as all free SlideFab 2 LITE edition.
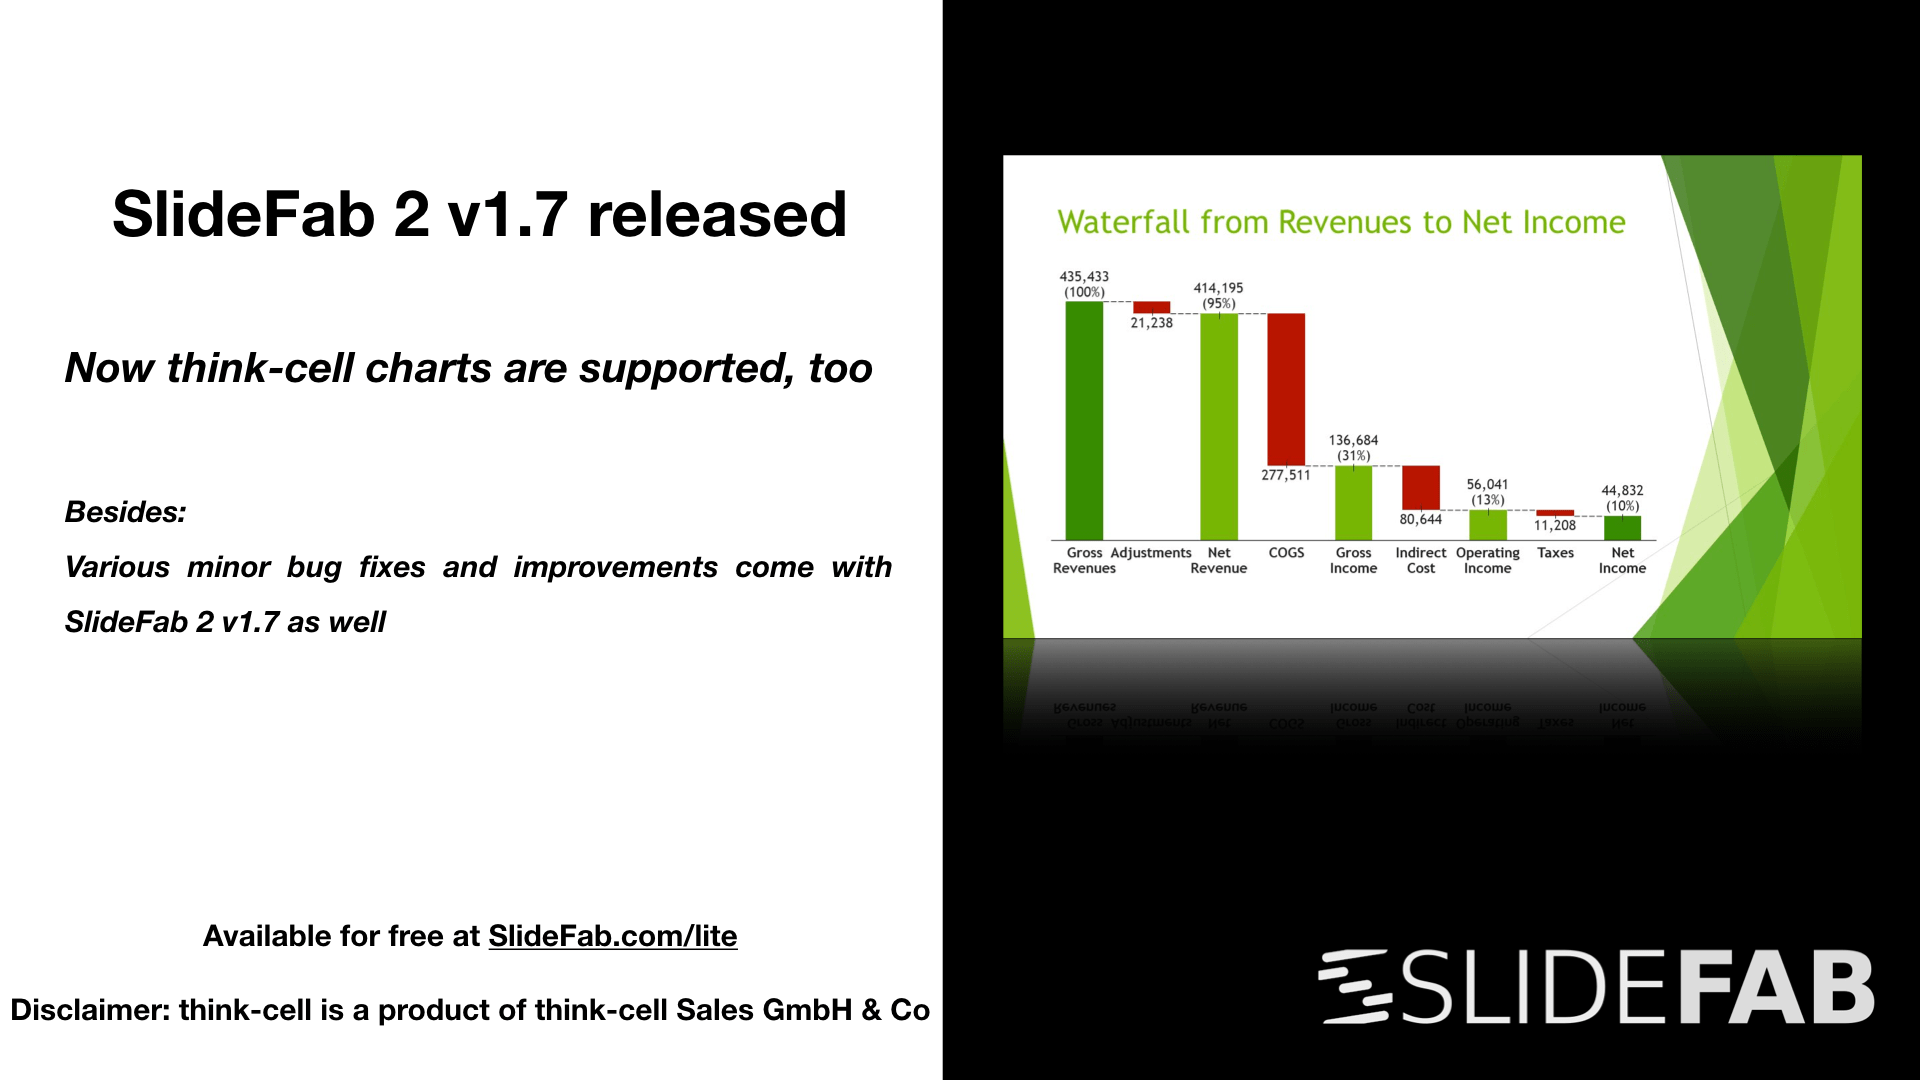
SlideFab 2 v1.7 brings not many updates but for fans of think-cell a significant one: When a PowerPoint template slide contains one or more Excel-linked think-cell charts, SlideFab will allow the chart update and break the Excel links for the output slides. In this way the output slides will contain real think-cell charts (not just mere screenshots or so) which can be fine-tuned or altered when required. Further information about how this works can be found in the documentation.
The art of creating PowerPoint presentations is topic of a whole industry: Templates, tutorials, manuals, best practices, etc. are offered to enable users to sculpture one perfect presentation. However, so much effort for one presentation does not scale well, e.g. when each country, business unit, team leader, etc needs a dedicated presentation. In such cases mass creating slides and presentations can help: Same structure but different data. In most cases the outcome is not very emotional or thrilling as titles or annotations do not reflect the message conveyed through the data. The slides tell no story. In fact, one might argue that a phonebook is more exciting. Unfortunately, the situation is as follows: One gets either customization or economies of scale.
However, this article is about approaches to bring more customization to mass-produced slides. Even though these tipps are meant for SlideFab 2, some will find them helpful for manual automation coding with VBA or Excel modeling in general. So, here are some ideas which explain how to get more customization when mass producing PowerPoint slides or presentation based on Excel.
SlideFab 2 v1.6 is available now. It brings a couple of minor bug fixes and improvements . Of course, this version is also available as all free SlideFab 2 LITE edition.
How much time does SlideFab 2 really save? In order to find that out there will be a competition between Alice and Bob. On the one hand, Alice uses SlideFab 2. On the other hand, Bob uses his own hands with high-performance copy and paste and leverages a small VBA snippet as turbo. The task will be to create dashboard slides in PowerPoint which are filled through an Excel-based calculation.
There are plenty of ways to visualize results from surveys and benchmarks. A classical one is a line plot of the Likert scale (i.e. Likert chart / plot). While it is a great chart type, it is a pity that Excel does not offer it out of the box.
There are manuals on the internet available on how to build a Likert chart with Excel. However, this post explains how to mass create multiple slides with Likert Charts with SlideFab 2 for free. This can be useful in benchmarking surveys for example, where each participant shall receive a personalized result presentation.
UPDATE: There was a bug in the Excel model which led to incorrectly drawn charts. Thanks to Thomas Seitz from http://www.tsm-marktforschung.de/ for pointing this out. The example files was updated, cf. below.
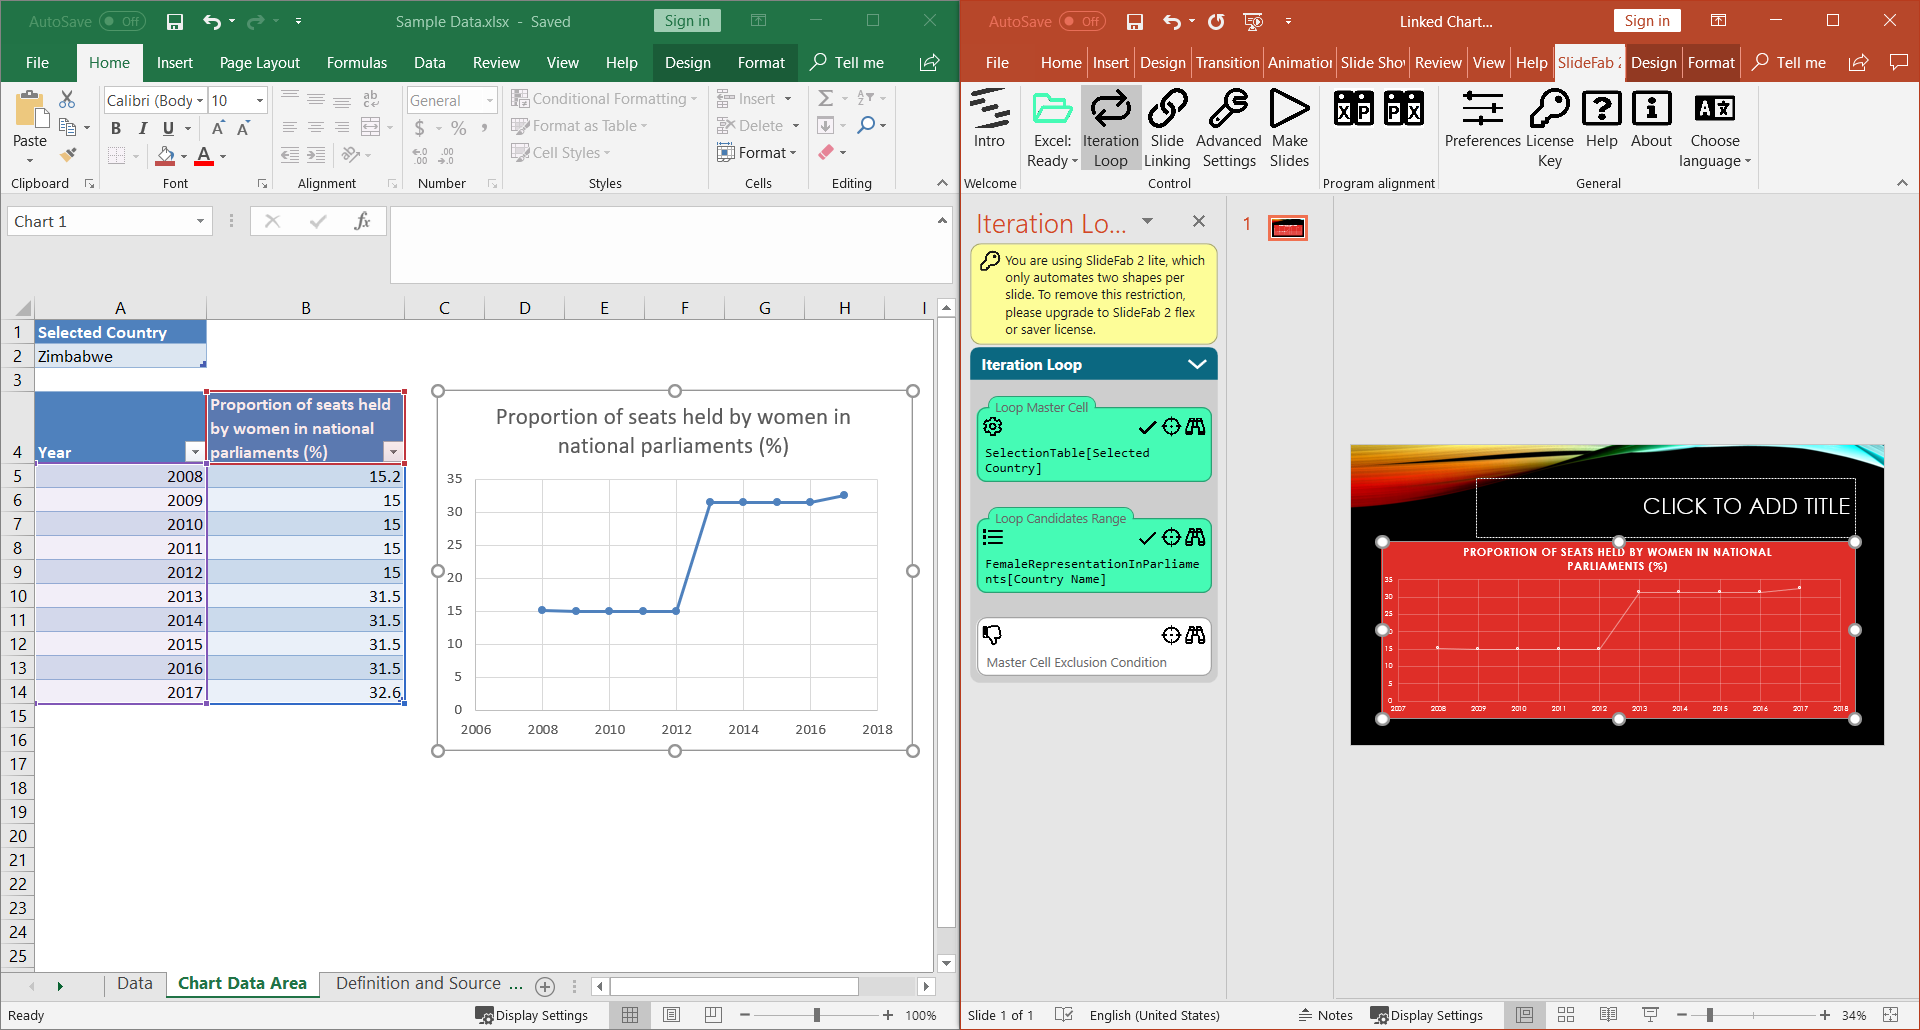
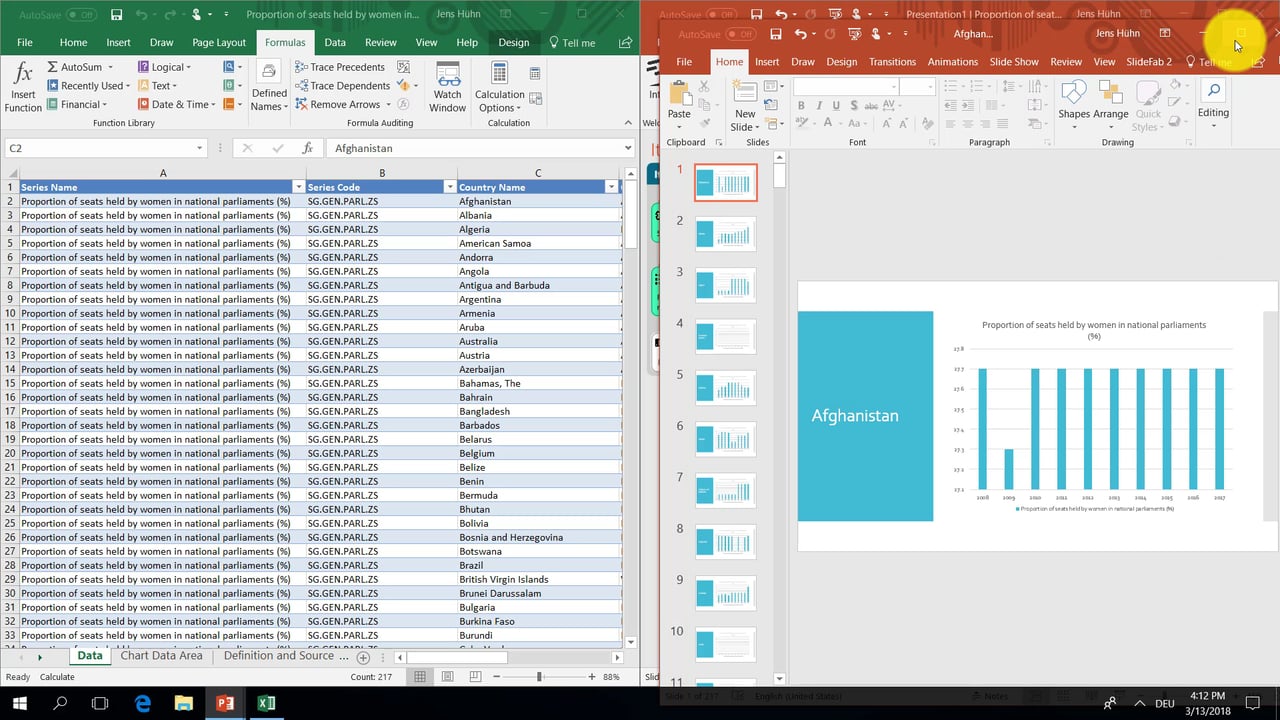
Automatically creating more than 200 Powerpoint slides with dynamic title and chart in 5 minutes for free? Learn how this works using SlideFab 2 LITE with linked charts in this blog post.
SlideFab 2 v1.5 comes with the great new feature to automate Excel-to-Powerpoint linked charts. This is a great addition to the existing SlideFab 2 features which can copy charts from Excel to Powerpoint as image and to update the data in Powerpoint charts. Of course, this feature is also supported in the all free SlideFab 2 LITE edition.
MINOR UPDATE 10th January, 2019: A new installer was made available as the old SSL certificate had expired.
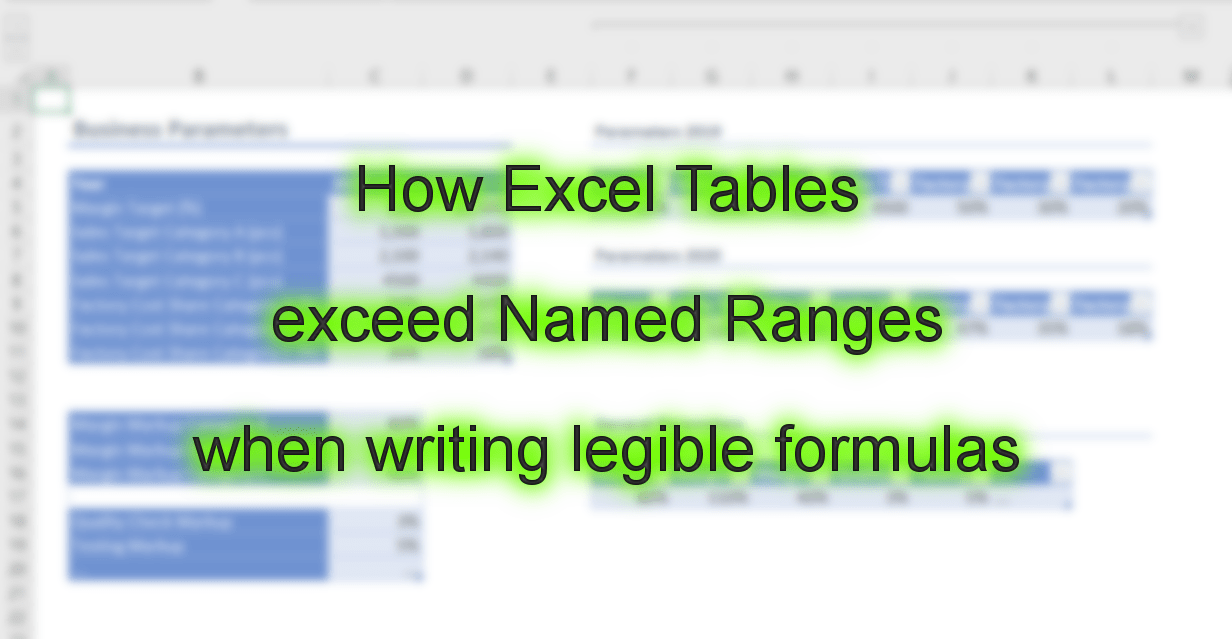
Creating legible Excel formulas is something which is very handy, typically. No matter whether another person or oneself needs to adopt and understand an Excel file. It can be difficult to find into the logic of an old or alien Excel file: Then even plain calculations can be hard to grasp. But there are also cases where complex workbooks are easy to understand. It depends, as always:
Imagine a classical way to make an Excel file hard to understand: Adding numerous references across worksheets to single cells. This happens quite often. Even to adapt Excel users: For example, they separate calculation sheets from a parameter sheet. Conceptually, this is a good idea, but things can get messy.
SlideFab 2 v1.3 is a bugfix update addressing a recent issue with the license server authentication: While activating SlideFab license, it was signaling “no internet… Read More »New SlideFab 2 v1.3 brings important bugfix
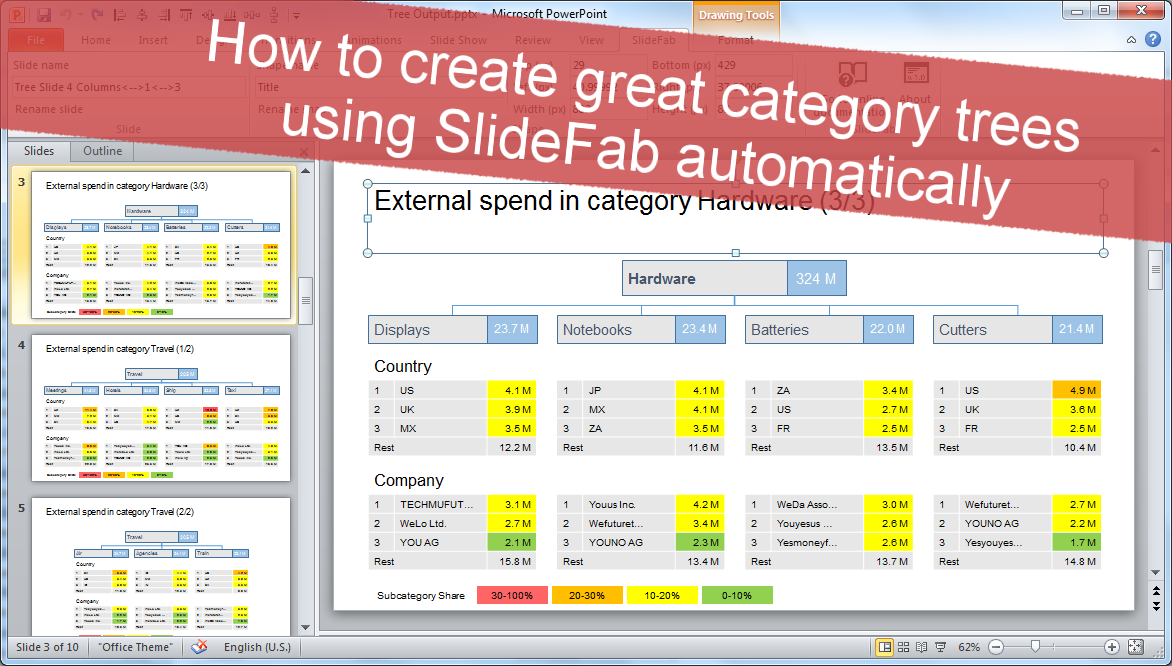
This SlideFab 2 video shows how to create Category Trees automatically. A Category Tree is a structured visualization of corporate spend. It serves for quickly showing where most money goes in terms of categories, sub categories, suppliers and countries.
UPDATE September 9th, 2022. This example still uses a VBA macro to filter the pivot table. With SlideFab 2 v7.0 the VBA macros can be substituted with the pivot field filtering function.
This video is based on a scenario where lots of data in Excel is used to create numerous slides with each having a Powerpoint chart. SlideFab will create the slides and update the data ranges for the charts automatically.
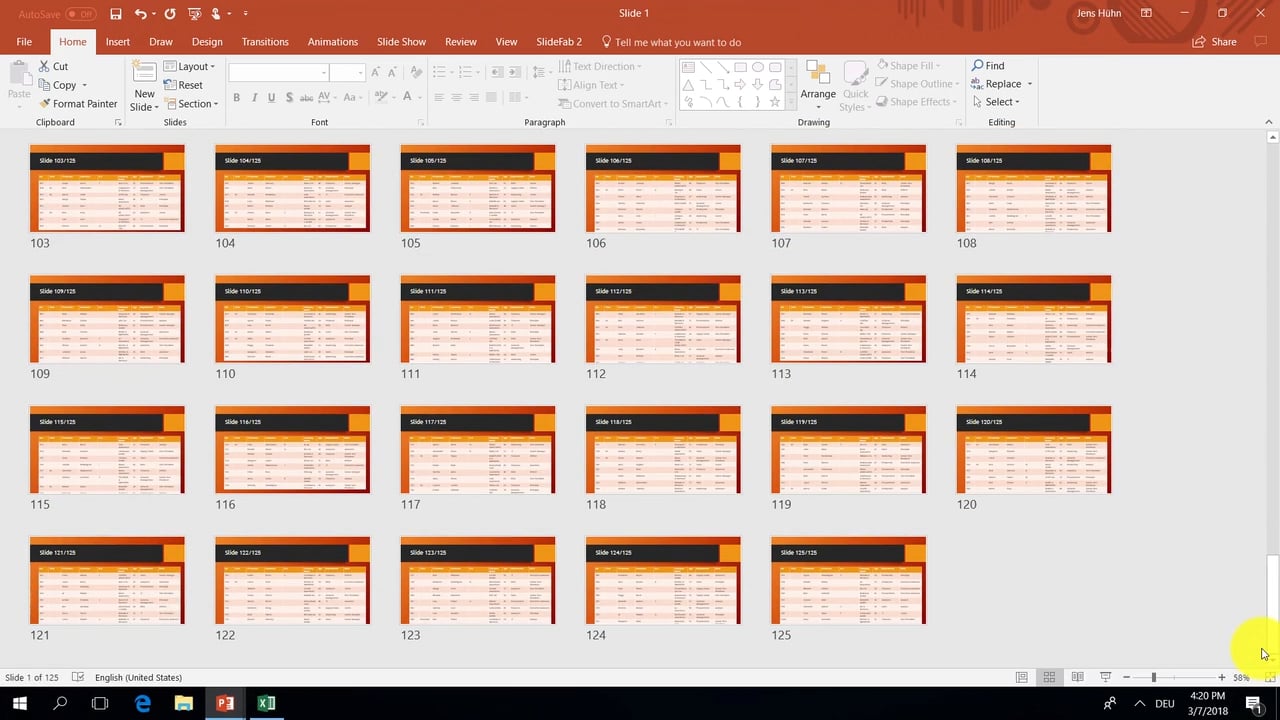
This video is based on a scenario where a table with 1,000 rows in an Excel table shall be brought to Powerpoint. As 1,000 rows are way too much for a single slide, the table shall be spread across multiple slides. Let’s call this Table Spreading. In this video the Slide Loop feature will be used to create 125 slides, where each one holds a Powerpoint table with 8 rows plus header.
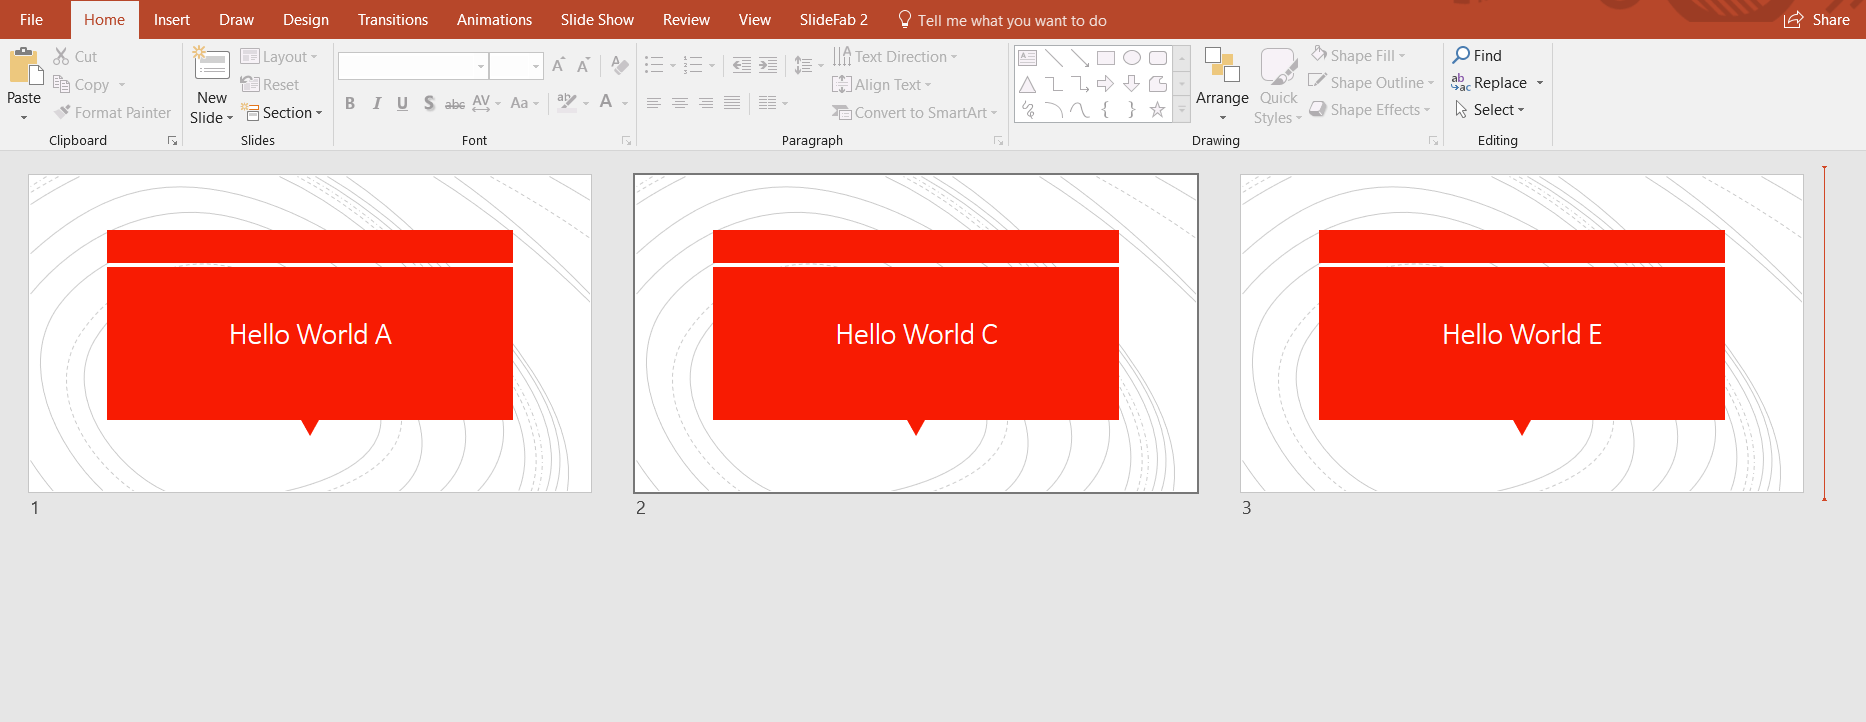
This video is based on the “Hello World” example and and incorporates a loop condition. The loop condition can be used to not create slides, if it does not evaluate to true. In this example the loop condition is used, to leave out every second slide. So instead of all 6 slides of the “Hello World” example only slides 1,3 and 5 (candidate values “A”, “C” and “E”) will be created.