The art of creating PowerPoint presentations is topic of a whole industry: Templates, tutorials, manuals, best practices, etc. are offered to enable users to sculpture one perfect presentation. However, so much effort for one presentation does not scale well, e.g. when each country, business unit, team leader, etc needs a dedicated presentation. In such cases mass creating slides and presentations can help: Same structure but different data. In most cases the outcome is not very emotional or thrilling as titles or annotations do not reflect the message conveyed through the data. The slides tell no story. In fact, one might argue that a phonebook is more exciting. Unfortunately, the situation is as follows: One gets either customization or economies of scale.

However, this article is about approaches to bring more customization to mass-produced slides. Even though these tipps are meant for SlideFab 2, some will find them helpful for manual automation coding with VBA or Excel modeling in general. So, here are some ideas which explain how to get more customization when mass producing PowerPoint slides or presentation based on Excel.
1. Creating dynamic titles as a way of customization of mass-produced slides and presentations
When automatically creating PowerPoint slides it is mostly about updating numbers or charts. Whereas legends or descriptive titles (e.g. “Annual revenue in mn. EUR vs. Net margin %”) do not need to change. Alternatively, a true action title reflects an interesting or surprising message for the reader, e.g. “Annual revenue increased by 2.5% without affecting net margin (+0.05%)”.
It is simple to explain how to create such a title in mere words: Calculate some value and find a suitable text block using this value from a list or table. To make such a text block more lively, placeholders for later replacement bring in some customization, e.g. “Annual revenue increased by [percentValue]”.
In Excel such a dynamic title like can be created as follows:
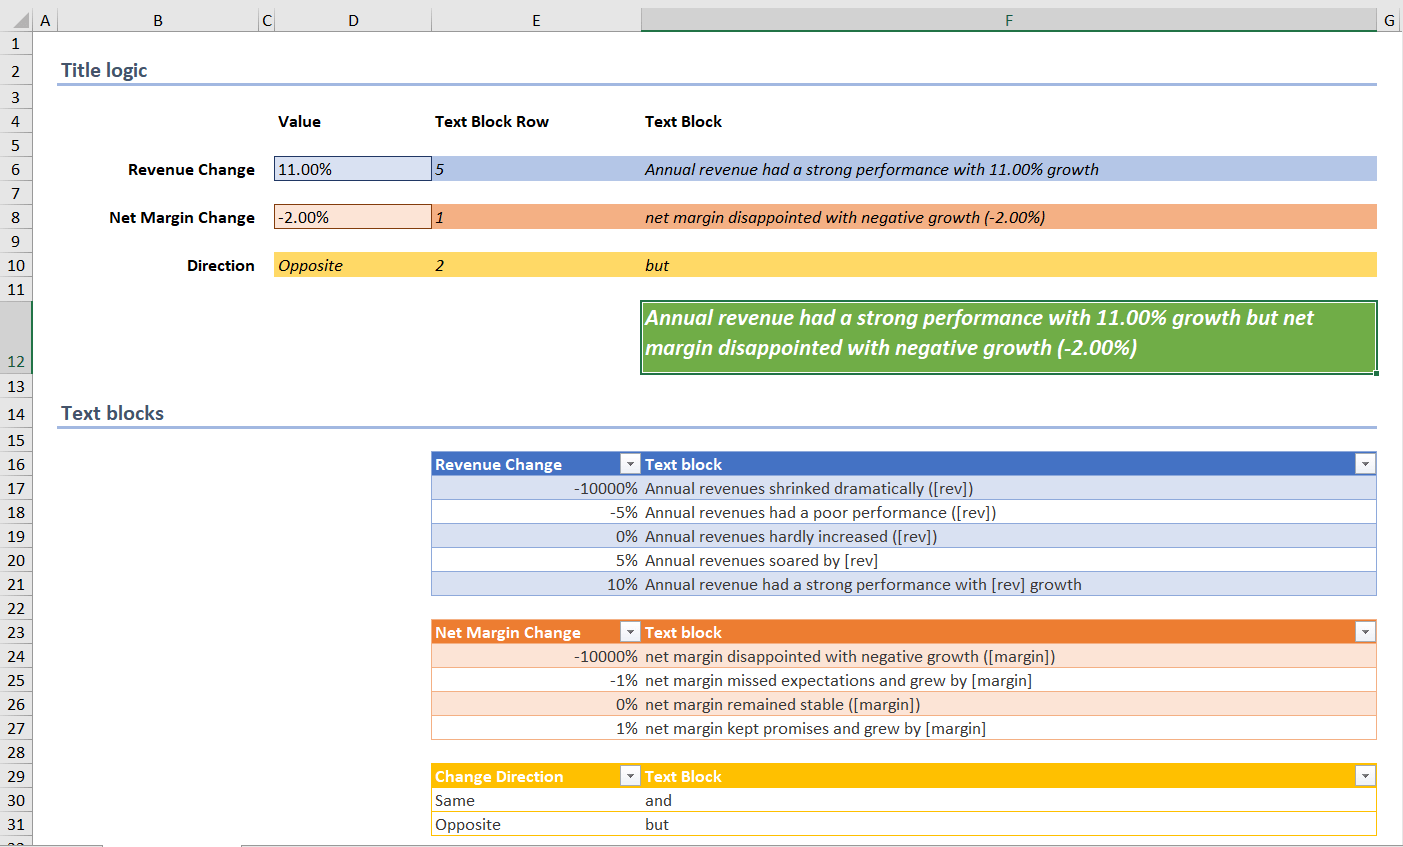
The following example is about connecting two text blocks with “but” or “and” to create an action tile. The first text block is about revenue change while the second is about margin change. The following screenshot shows an Excel worksheet with the necessary parts. Basically, there are two regions: 1) The title logic with values and formulas to retrieve and process the text blocks and 2) the tables with text blocks and numeric data used for lookup formulas. For sake of clarity the parts belonging together have the same color: Revenue in blue, net margin in orange and direction (“but” vs “and”) in yellow. The cell in green shows the dynamic title for this customized slide.
So what is required for dynamic titles here:
- The revenue change phrase requires a table with two columns. The first column contains a threshold value (here percentage values). The second column holds the text blocks (table RevenueChangeTable at range E16:F21). The margin change text block and also the middle part (“and”, “but”) require separate tables.
- Of course, some cell has to hold the current revenue change value (cell D6). For margin it is the same (cell D8). For the middle part (“and”, “but”) it will be checked whether revenue change and margin change are both positive or both negative. This would be “same” direction and “opposite” direction otherwise (cell D10).
- With the revenue change number the table row with the suitable text block has to be found (table RevenueChangeTable at range E16:F21). Therefor the MATCH formula will be applied using approximate match type parameter “1” (cell E6). For margin change it is the same (cell E8). For direction the MATCH formula uses exact match parameter “0” (cell E10).
- With the row number given the INDEX formula retrieves the revenue change text block. Afterwards the SUBSTITUTE formula replaces the placeholder with the actual value (cell F6). For margin change it is the same (cell F8) and for direction – apart from the substitution – too (cell F10).
- Finally, as all three parts of the title are prepared, they get concatenated with some blanks in between (cell F12).
Formulas used in the example:
- D10: =IF(OR(AND(D6>=0,D8>=0),AND(D6<0,D8<0)),”Same”, “Opposite”)
- E6: =MATCH(D6,RevenueChangeTable[Revenue Change],1)
- E8: =MATCH(D8,NetMarginChangeTable[Net Margin Change],1)
- E10 =MATCH(D10,ChangeDirectionTable[Change Direction],0)
- F6: =SUBSTITUTE(INDEX(RevenueChangeTable[Text block],E6), “[rev]”, TEXT(D6,”0.00%”))
- F8: =SUBSTITUTE(INDEX(NetMarginChangeTable[Text block],E8), “[margin]”, TEXT(D8,”0.00%”))
- F10: =INDEX(ChangeDirectionTable[Text Block],E10)
- F12: =F6&” “&F10&” “&F8
2. Custom shape composition for individualizing mass-produced slides
Changing the shapes composition works as well to individualize similarly structured slides or presentations beyond updating numbers. Shapes composition means showing different “enriching” shapes for slides based on the same template. From an automation point of view, the idea is simple: First of all, put all enriching shapes on the template slide. Secondly, during mass production let the automation delete superfluous shapes.
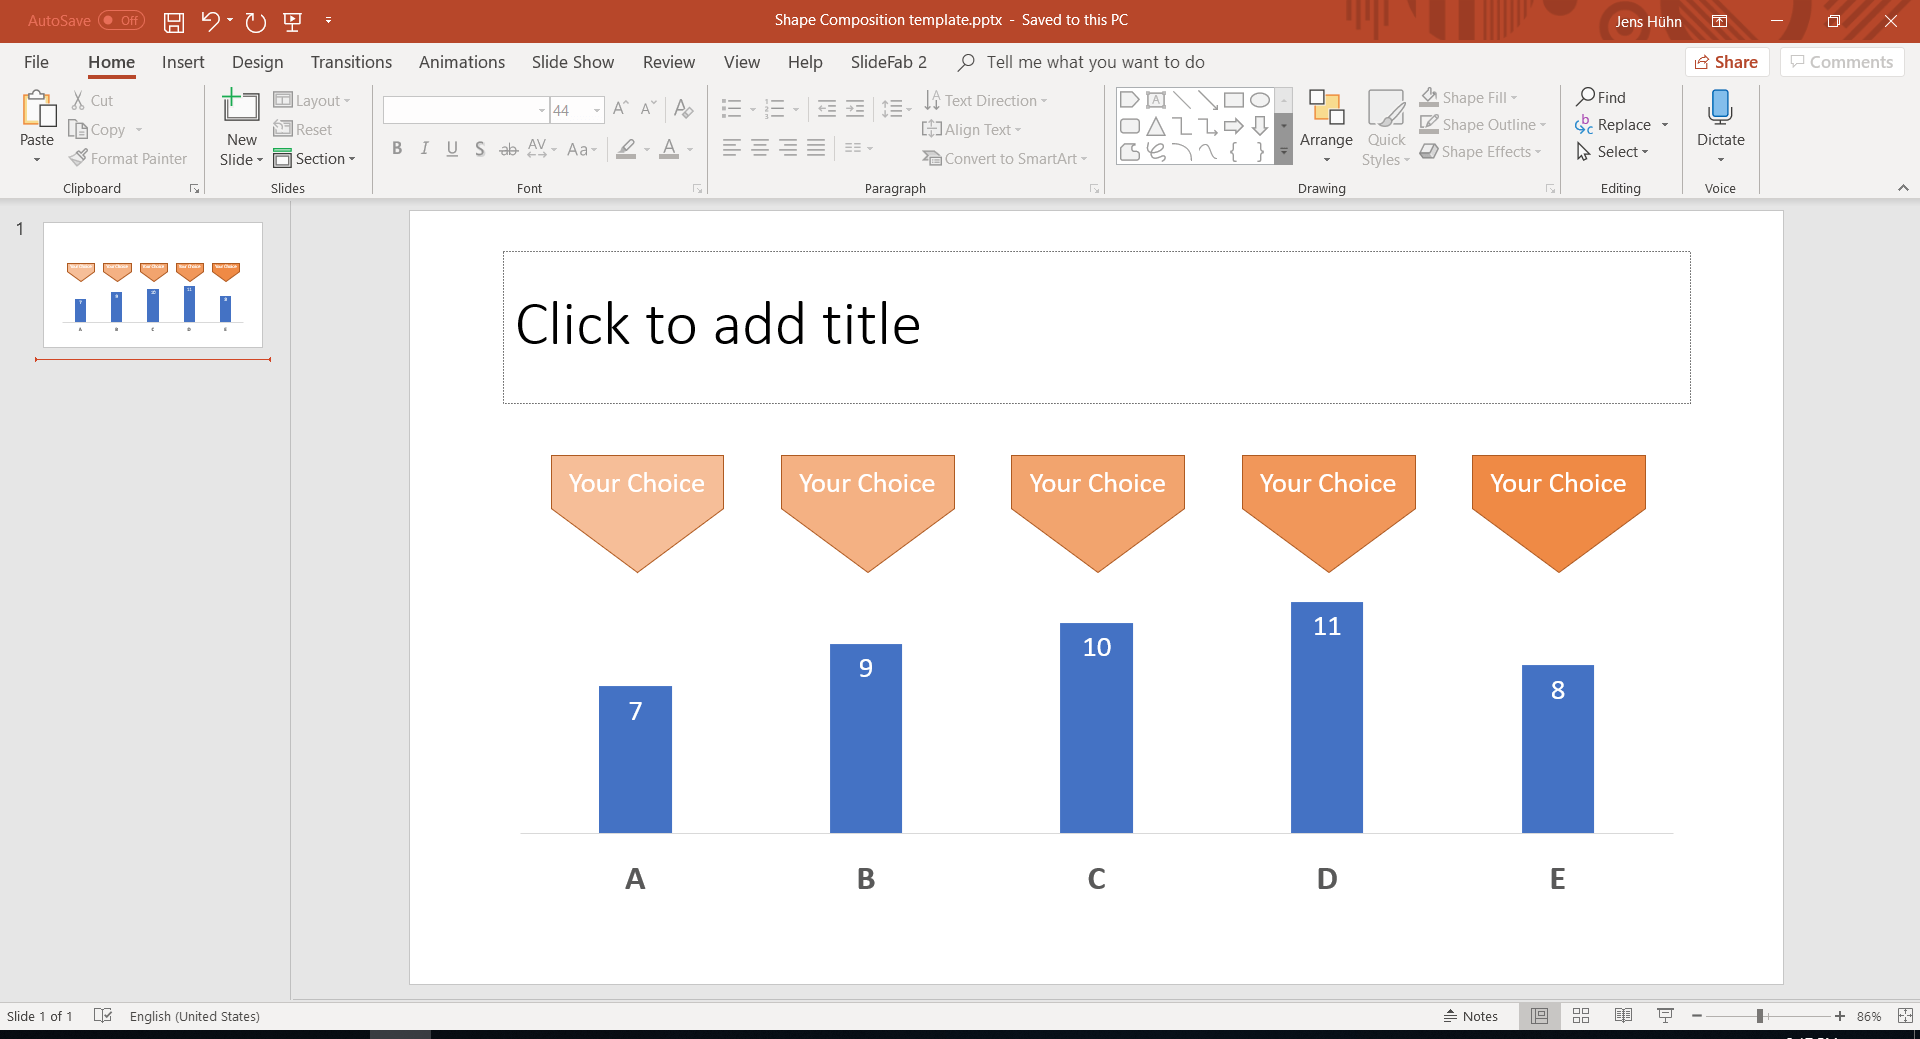
For example, consider the following slide template. It is about a survey in which participants had to make a choice between five options from A to E. For sake of this example, the task is to provide an individual feedback slide for each participant. Surprisingly each participant will see the same chart. But the marker reflecting their personal choice will be individual. Thus, the template could look like this:
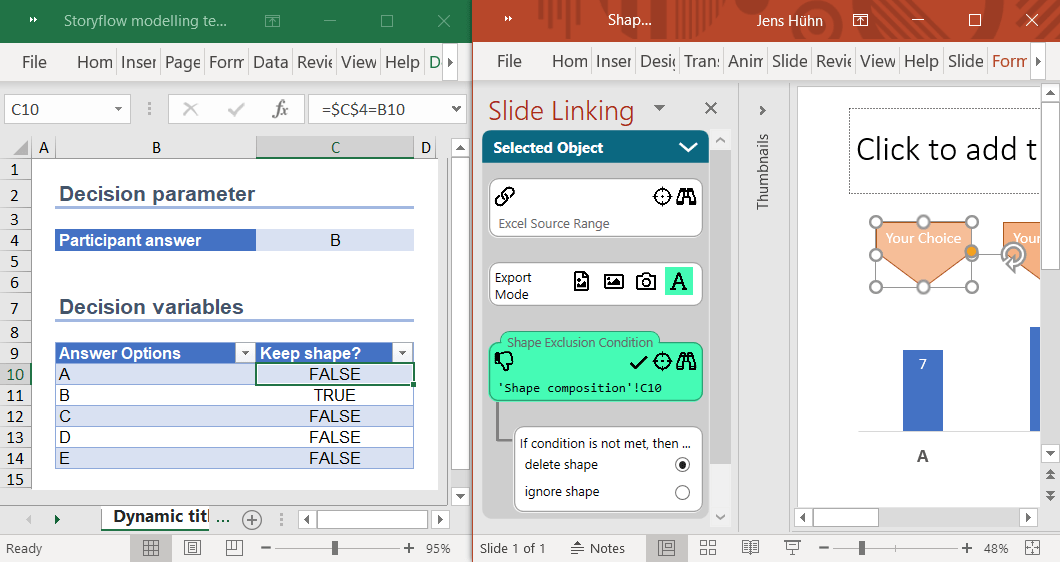
To achieve the individualization each of the markers needs to link to an Excel cell. This Excel cell calculates whether the shape shall be deleted or not. With SlideFab 2 the Shape Condition feature will delete the shape. It removes the shape if deletion is selected and the formula evaluates to 0 or false. Therefor, these conditions (range C10:C14) contain formulas comparing the user’s choice (cell C4) with each option (range B10:B14). If values are different, it returns false. And false means here that SlideFab 2 deletes the shape in the created presentation.
When running the automation to create all personalized slides, five different outcomes can occur. These look like this:

3. Custom slide composition for customization of mass-produced presentations
Formula-based deletion of shapes and formula-based dynamic titles make a presentation look more handcrafted. On top of these it is possible to assemble a slide collection in a customized way. The approach is about writing an Excel formula which decides whether a certain slide of the presentation template will be kept in the process or not. When creating presentations automatically there are two types of slides: 1) Static slides which are the same across all variants created. This can be a basic introduction, terms and conditions, list of offices or some further generic slide. 2) Slides which are linked to an Excel which might be different in each of the variants. For the custom slide composition it does not matter.
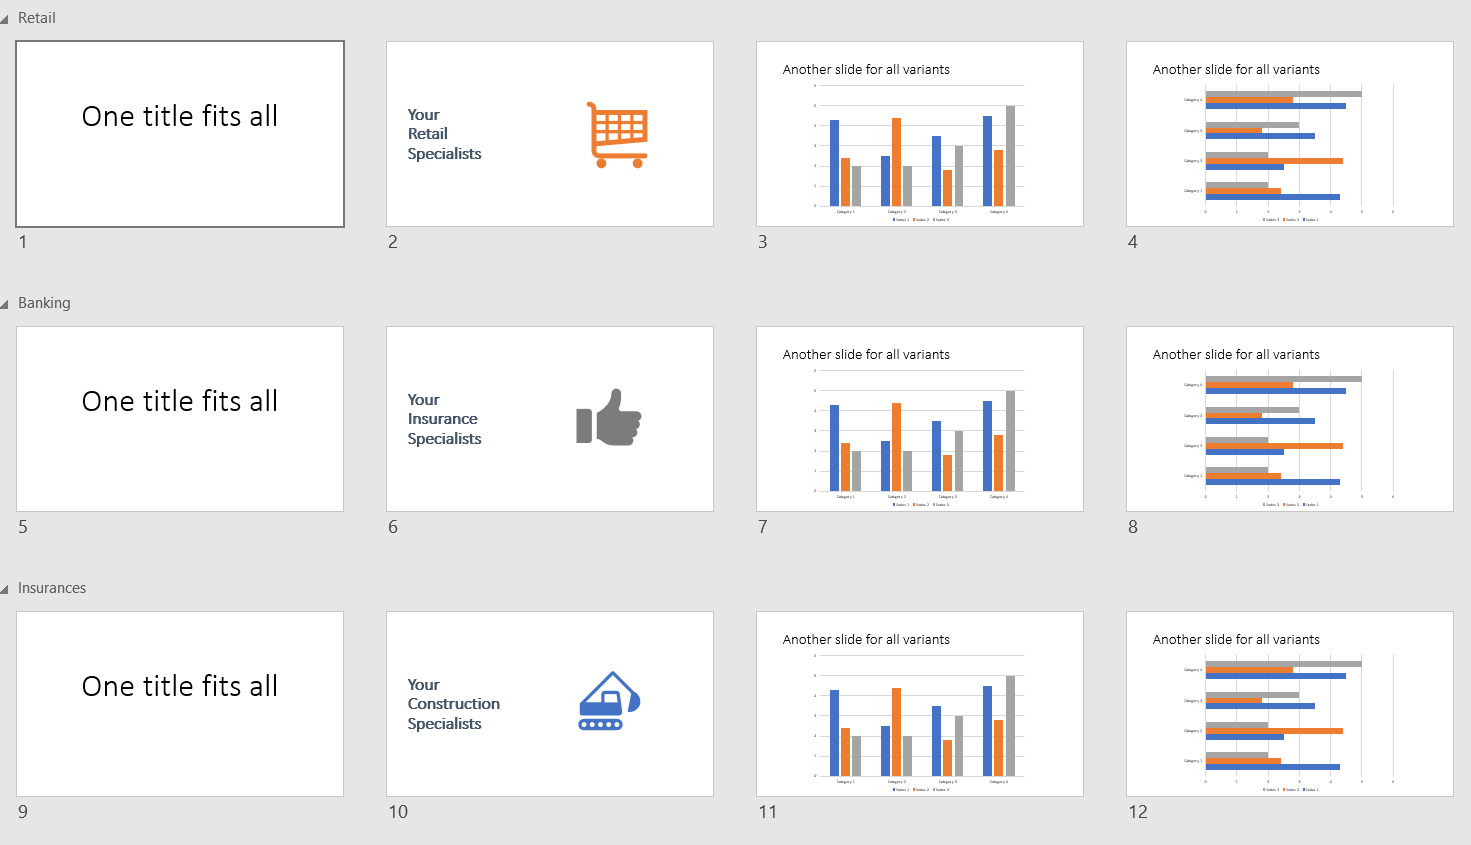
Consider the following example: Different industries need to get a custom-tailored presentation each. In this basic example there will be a unique slide per industry. The template presentation contains all different industry slides, as seen below. When set With the Slide Exclusion Condition of SlideFab 2 only the appropriate industry slide will be selected.
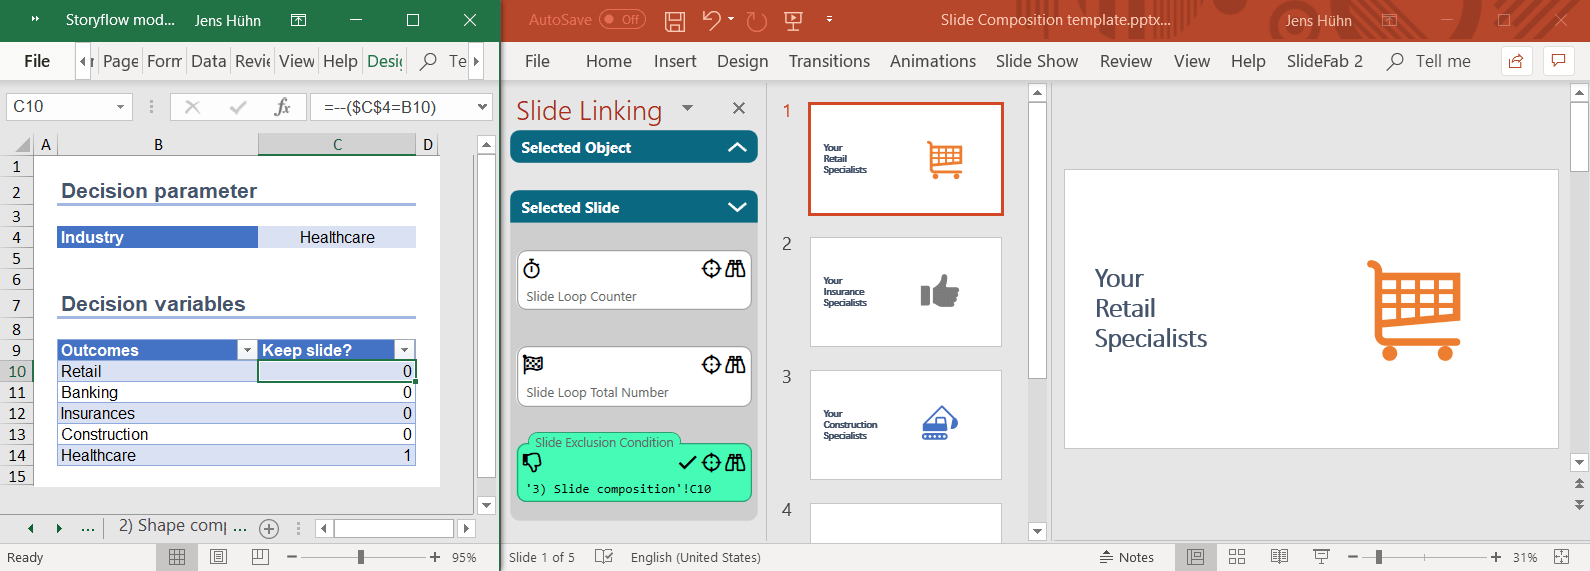
To showcase the outcome the template presentation shall be created for each industry once. Accordingly, every created presentation will contain the right industry slide.
4. Unique slide sort order to prioritize slides of mass-produced presentations as a way of customization
When illustrating data on slides the right slide order is often relevant: Typically, important insights come first. Sorting slides is a way of customizing mass-produced presentations which is helpful for the reader. For example, when illustrating sales performance: One can think of creating one presentation per month. For each month the slides are sorted by descending performance. In combination with the custom slide composition mentioned above, monthly top 3 sales performances could be shown on one slide each.
Consider the following simplified, case where only one presentation shall be created. It is sufficient for showing how to incorporate sorting as customization. The Excel screenshot below shows a list of sales agents and their performance scores. For each sales agent a slide shall be created. Afterwards, the slides need to be drawn by descending sales performance. So, for the currently considered sales agent (cell B5) a VLOOKUP or (better) INDEX/MATCH formula (cell C5) retrieves the sales performance. SlideFab 2 will use this value when it is defined in the Excel Sort Cell within the Advanced Settings pane.
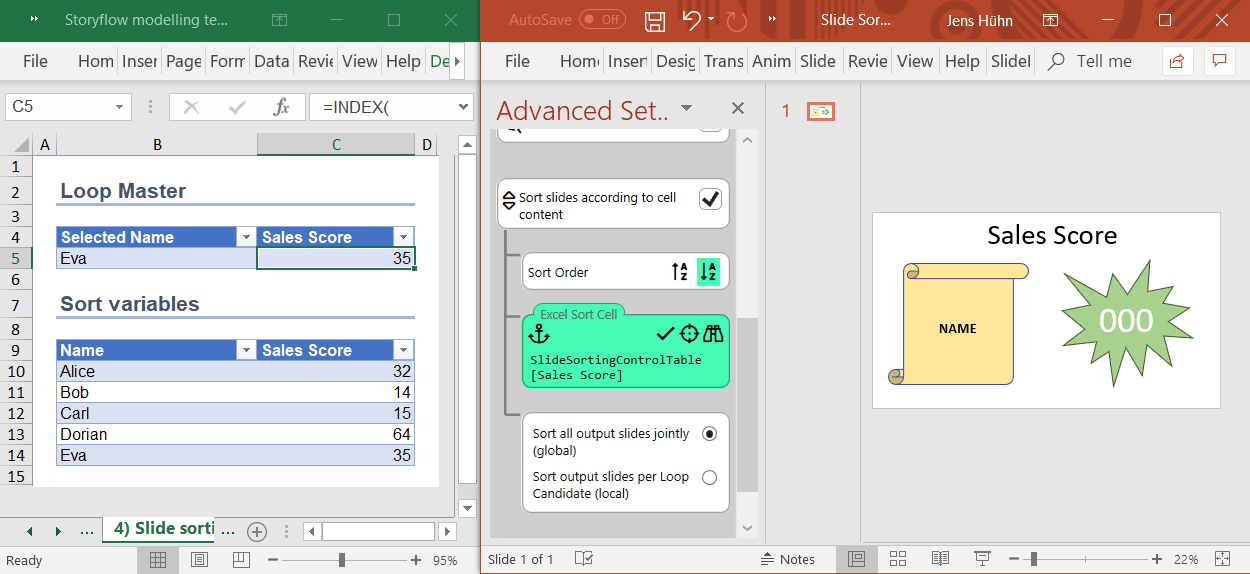
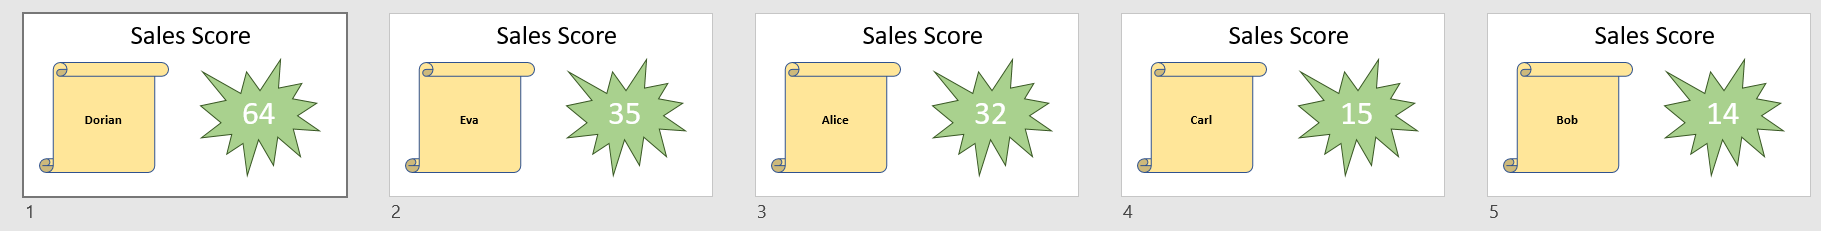
With this setup and a defined automation will SlideFab 2 create one slide per sales agent:
When creating the collection (mentioned above) with one presentation per month, it gets a little more complicated. Without going into details, the approach required here could use the Slide Loop feature of SlideFab 2, for example.
Conclusion
Even though mass-production of PowerPoint slides delivers similar results, there are simple solutions to bring in customization and individualization. This is particularly helpful for presentations which shall not look like coming the assembly line. Apart from delivering results which look more like handcrafted there is another benefit: The mass production approach delivers high degrees of quality as well as reproducibility. So if the Excel model works well, the marginal costs, to create another slide or presentation based on new or update data, goes towards zero. Thus, the amount of time saved using this approach can be huge (as also shown in the human-vs-machine comparison).