UPDATE: Check out an even simpler and faster way to automate this example using linked charts based on the new SlideFab 2 v1.5. Never the less, the approach below is still valid.
This video is based on a scenario where lots of data in Excel is used to create numerous slides with each having a Powerpoint chart. SlideFab will create the slides and update the data ranges for the charts automatically.
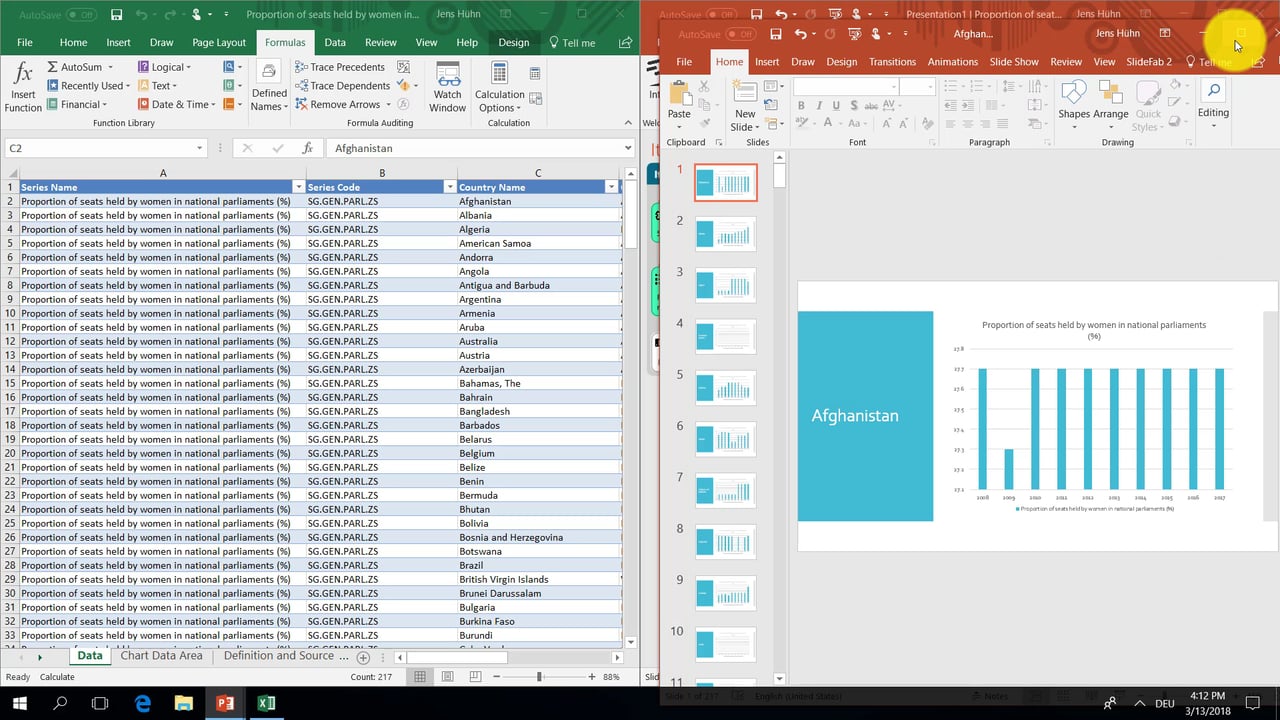
The data used in this example originates from the World Bank: Proportion of seats held by women in national parliaments (%) by year and country. This data should be representative for many other data sets: Categorized numerical time series data where for each category a chart is required.
In this example one slide will be created per country. Each slide will be about one country and contain a bar chart by year and a shape with the country name.
Basically, the video contains three implicit chapters:
- How to create a Powerpoint slide featuring a Powerpoint chart. This is very basic as it only involves inserting a bar chart into an empty slide,
- How to write the formulas to have a dynamic data range in Excel for the chart. This step involves writing a formula with INDEX and MATCH as a lookup to obtain the numbers for a specific country.
- How to link the Excel workbook with the Powerpoint presentation with SlideFab for automatically creating the slides. Finally, this step is about setting up the iteration loop using the selected country cell and the country list as well as selecting the dynamic Excel data range for the chart on the template slide.
Here you will also find the Excel workbook and Powerpoint presentation file as download, which can be tried out with SlideFab 2 right away. These files are prepared already, containing formulas and settings as shown in the video.