What it does

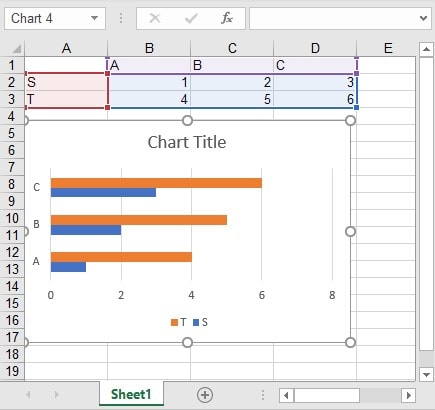
SlideFab will take a chart from Excel and recreate at the position of the target shape withinPowerPoint. The target shape has only the purpose of defining location and size of the new chart. SlideFab will create an empty chart in PowerPoint and style it like the linked one in Excel. It copies the data from Excel into the embedded PowerPoint sheet such that no linking between the created chart and the existing Excel chart data is required.
SlideFab detects the kind of chart, e.g. scatter plot, bar chart, and decides whether categories or series can cleansed or sorted. Cleansing means that it removes empty categories or series in order to avoid gaps in the chart. In order to sort a chart the series or category and the sort direction needs to be chosen.
Additionally, it is possible to use the resizing and alignment features of SlideFab. It is possible to keep the aspect ratio, fit it to the target shape and to tie it vertically/horizontally to the target shape height/width. If the chart is not fitted to the target shape, then it can be horizontally and vertically aligned to the edges of the target shape.
What it expects from Excel
The Excel Chart Export Mode is rather easy to use. A chart needs to be created in PowerPoint and then it can be used as Excel Source Range. In case that the chart was styled in PowerPoint already, it makes sense to save the chart template (via right click on the chart in PowerPoint) and apply it to the Excel chart. This takes only a few seconds and, thus, is typically way faster than styling the chart in Excel from scratch.

SlideFab 2 Manual Outline
- Documentation
- Think twice before coding VBA from Excel to PowerPoint
- Quickstart to SlideFab 2
- How SlideFab 2 works
- Requirements for SlideFab 2
- The SlideFab 2 ribbon
- Creating think-cell charts with SlideFab 2 automatically
- Invoking slide automation from your own code using VBA and the SlideFab 2 API
- Best practice