Skip to content

Videos

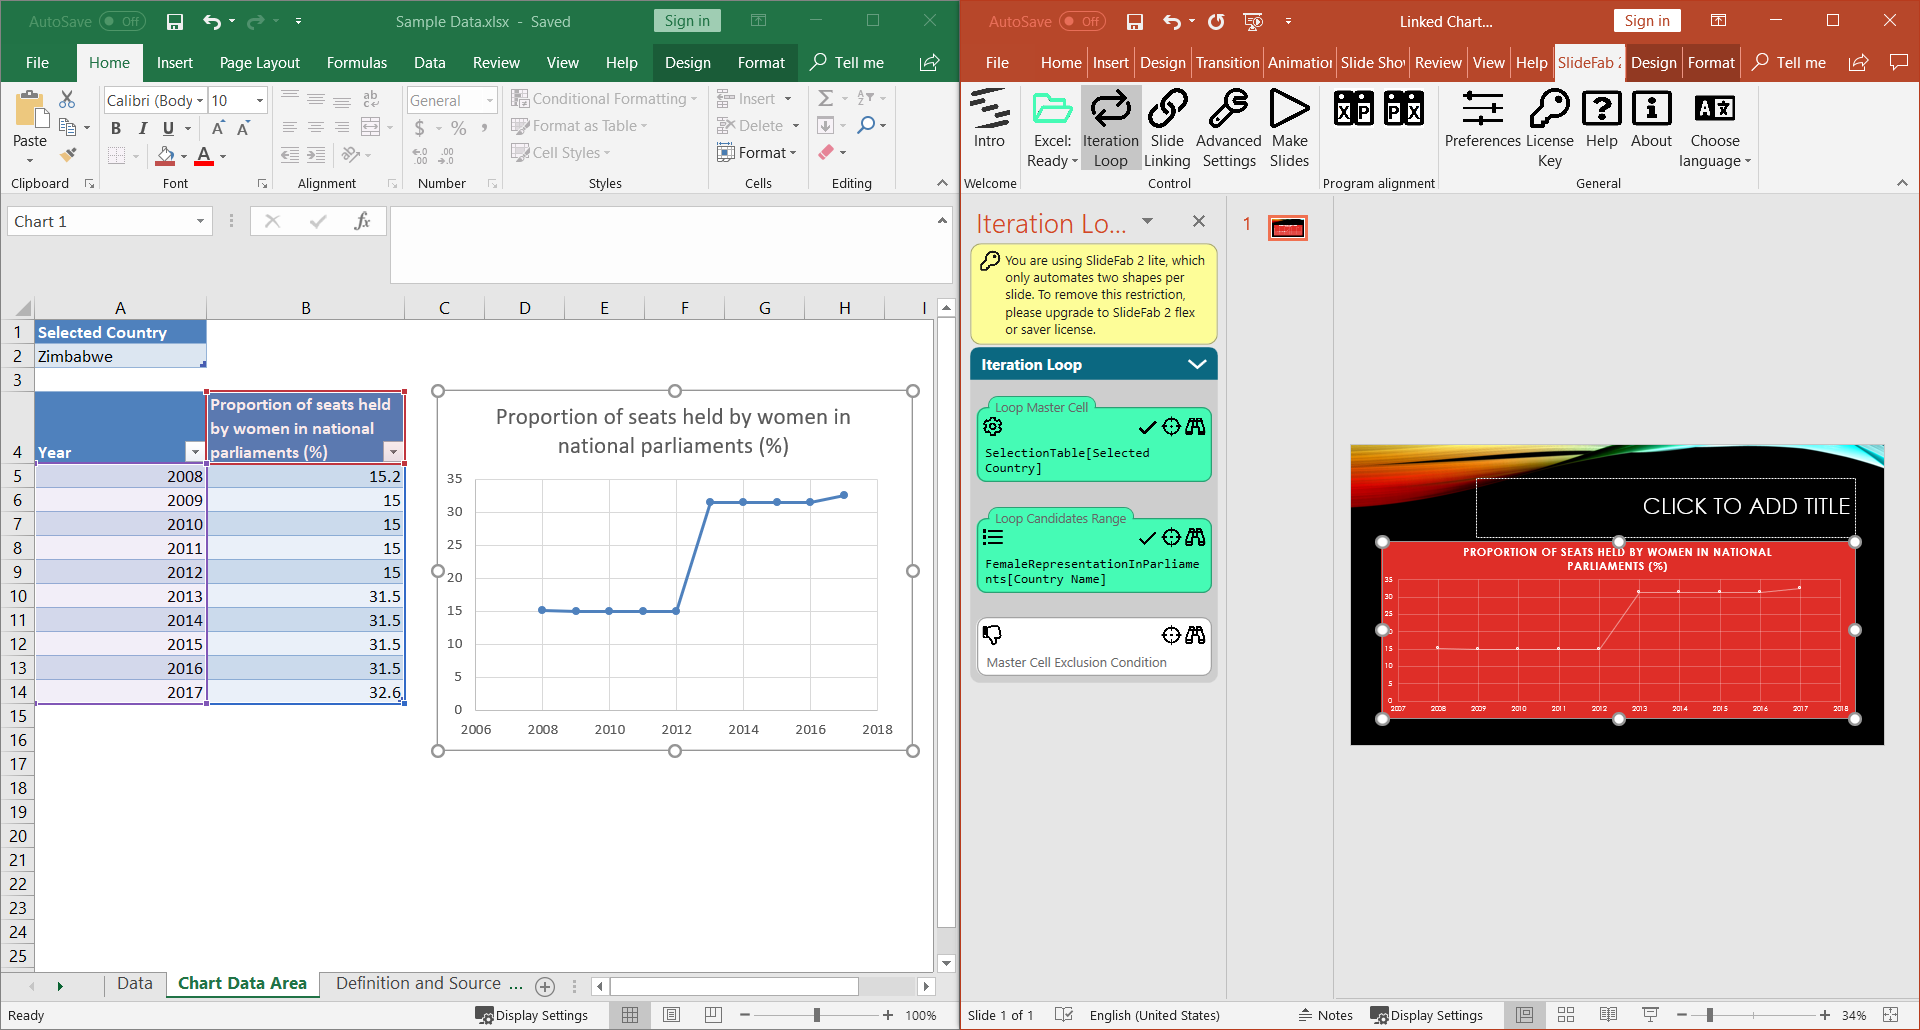
This is still picture from the video explaining the five different chart relevant Export Modes

Linking / exporting charts from Excel to PowerPoint using 5 different Export Modes of SlideFab

When creating recurring PowerPoint slides based on Excel workbooks, there are 5 different SlideFab Export Modes to choose from. This video elaborates on how to choose and employ the right Export Mode. The video shows how to set up the Excel model and the PowerPoint slide template for the use of SlideFab.

Read More »Linking / exporting charts from Excel to PowerPoint using 5 different Export Modes of SlideFab

SlideFab 2 dashboard competition title image

Human-vs-Machine: How SlideFab 2 performs against human brute force

How much time does SlideFab 2 really save? In order to find that out there will be a competition between Alice and Bob. On the one hand, Alice uses SlideFab 2. On the other hand, Bob uses his own hands with high-performance copy and paste and leverages a small VBA snippet as turbo. The task will be to create dashboard slides in PowerPoint which are filled through an Excel-based calculation.

Read More »Human-vs-Machine: How SlideFab 2 performs against human brute force
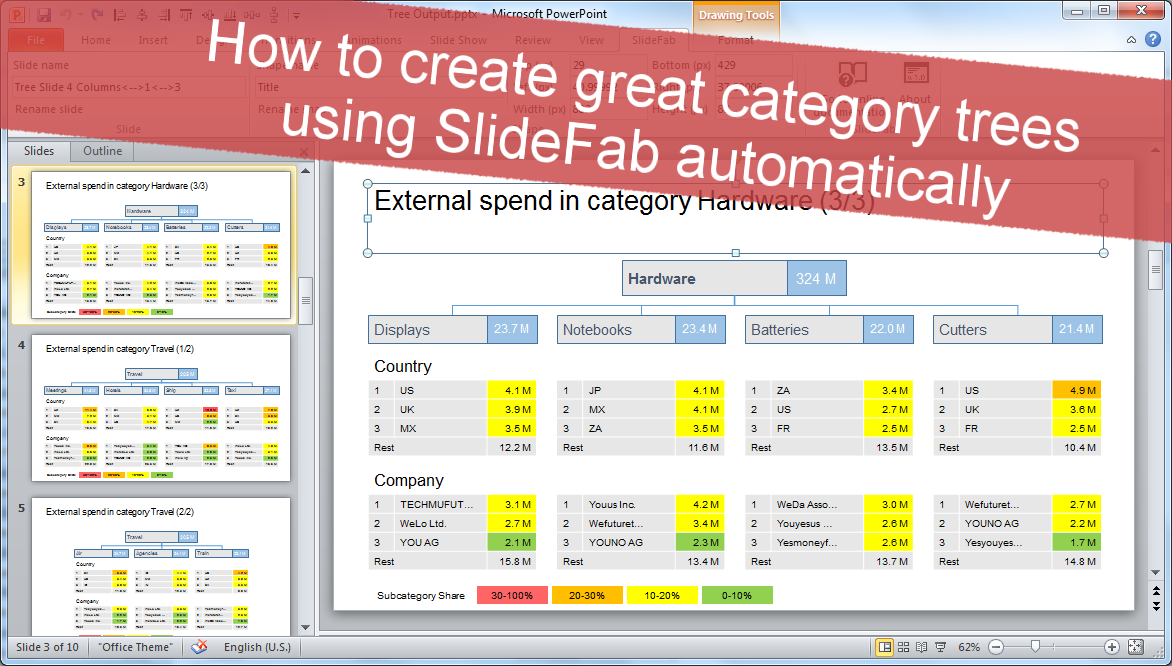
SlideFab category tree example image for the blog post

Automatically creating Category Trees in Powerpoint from Excel with SlideFab 2

This SlideFab 2 video shows how to create Category Trees automatically. A Category Tree is a structured visualization of corporate spend. It serves for quickly showing where most money goes in terms of categories, sub categories, suppliers and countries.

UPDATE September 9th, 2022. This example still uses a VBA macro to filter the pivot table. With SlideFab 2 v7.0 the VBA macros can be substituted with the pivot field filtering function.

Read More »Automatically creating Category Trees in Powerpoint from Excel with SlideFab 2

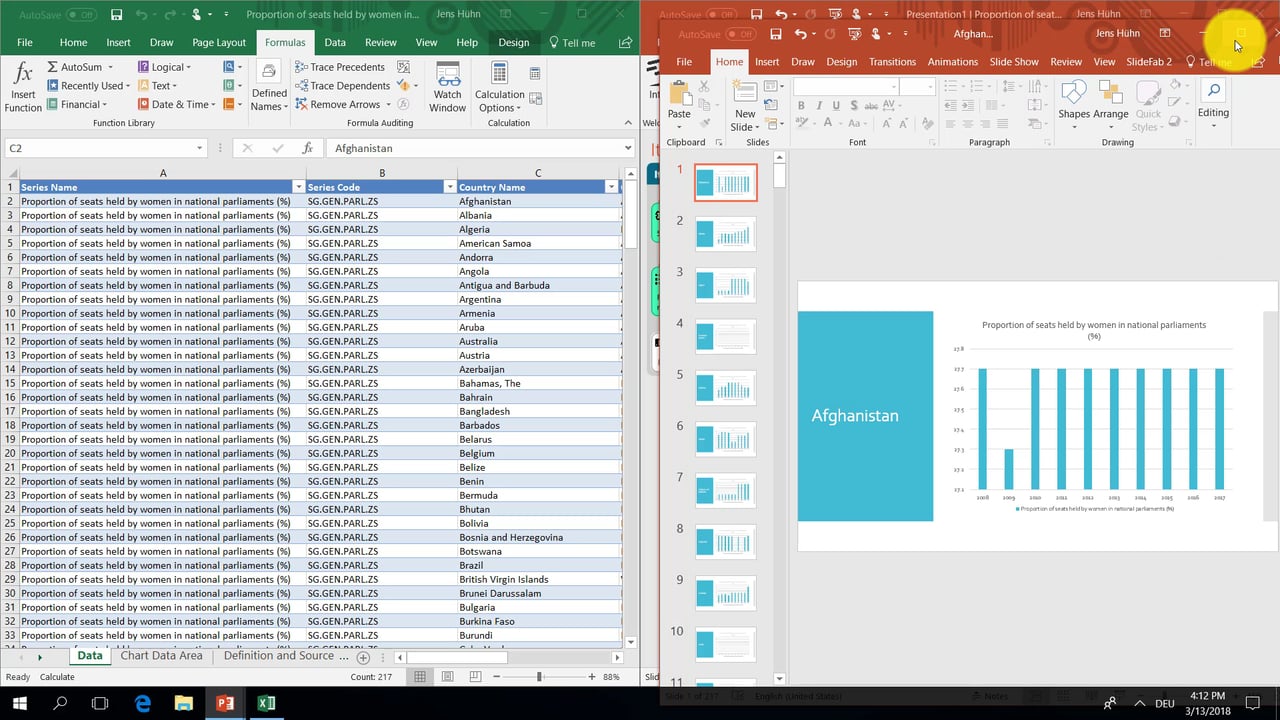
How to easily automate creating slides with a Powerpoint chart from Excel

UPDATE: Check out an even simpler and faster way to automate this example using linked charts based on the new SlideFab 2 v1.5. Never the less, the approach below is still valid.

This video is based on a scenario where lots of data in Excel is used to create numerous slides with each having a Powerpoint chart. SlideFab will create the slides and update the data ranges for the charts automatically.

Read More »How to easily automate creating slides with a Powerpoint chart from Excel

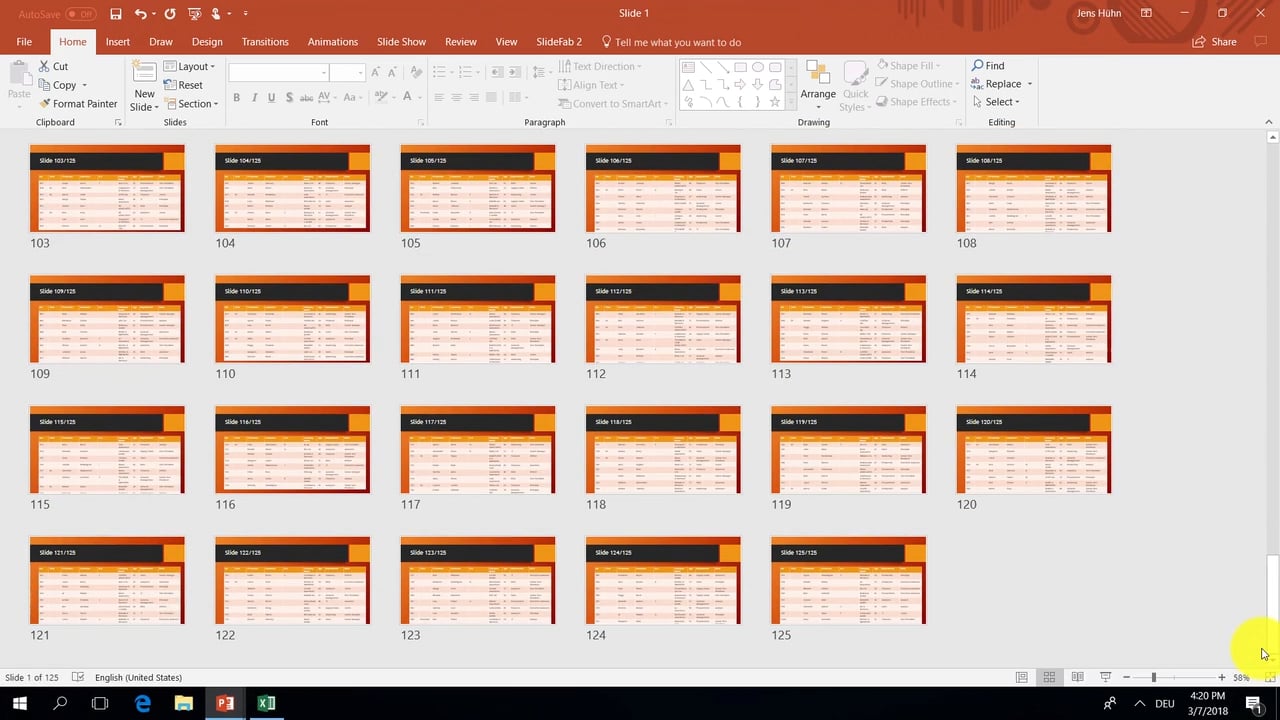
Table spreading across slides

This video is based on a scenario where a table with 1,000 rows in an Excel table shall be brought to Powerpoint. As 1,000 rows are way too much for a single slide, the table shall be spread across multiple slides. Let’s call this Table Spreading. In this video the Slide Loop feature will be used to create 125 slides, where each one holds a Powerpoint table with 8 rows plus header.

Read More »Table spreading across slides
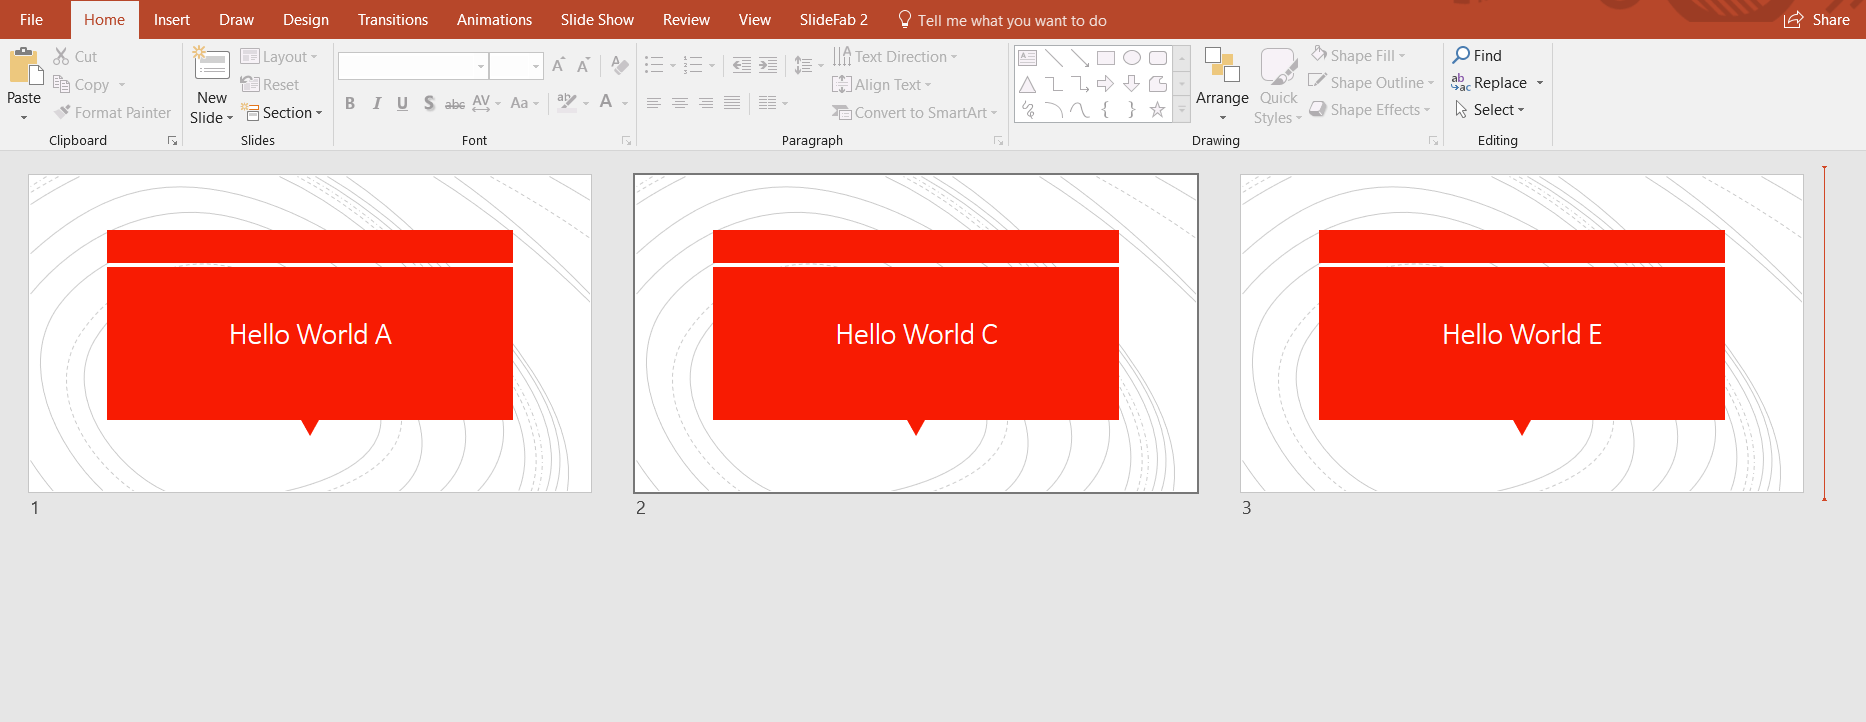
Screenshot of the Loop Condition example video showing the created slides

Loop Condition Example

This video is based on the “Hello World” example and and incorporates a loop condition. The loop condition can be used to not create slides, if it does not evaluate to true. In this example the loop condition is used, to leave out every second slide. So instead of all 6 slides of the “Hello World” example only slides 1,3 and 5 (candidate values “A”, “C” and “E”) will be created. 

Read More »Loop Condition Example
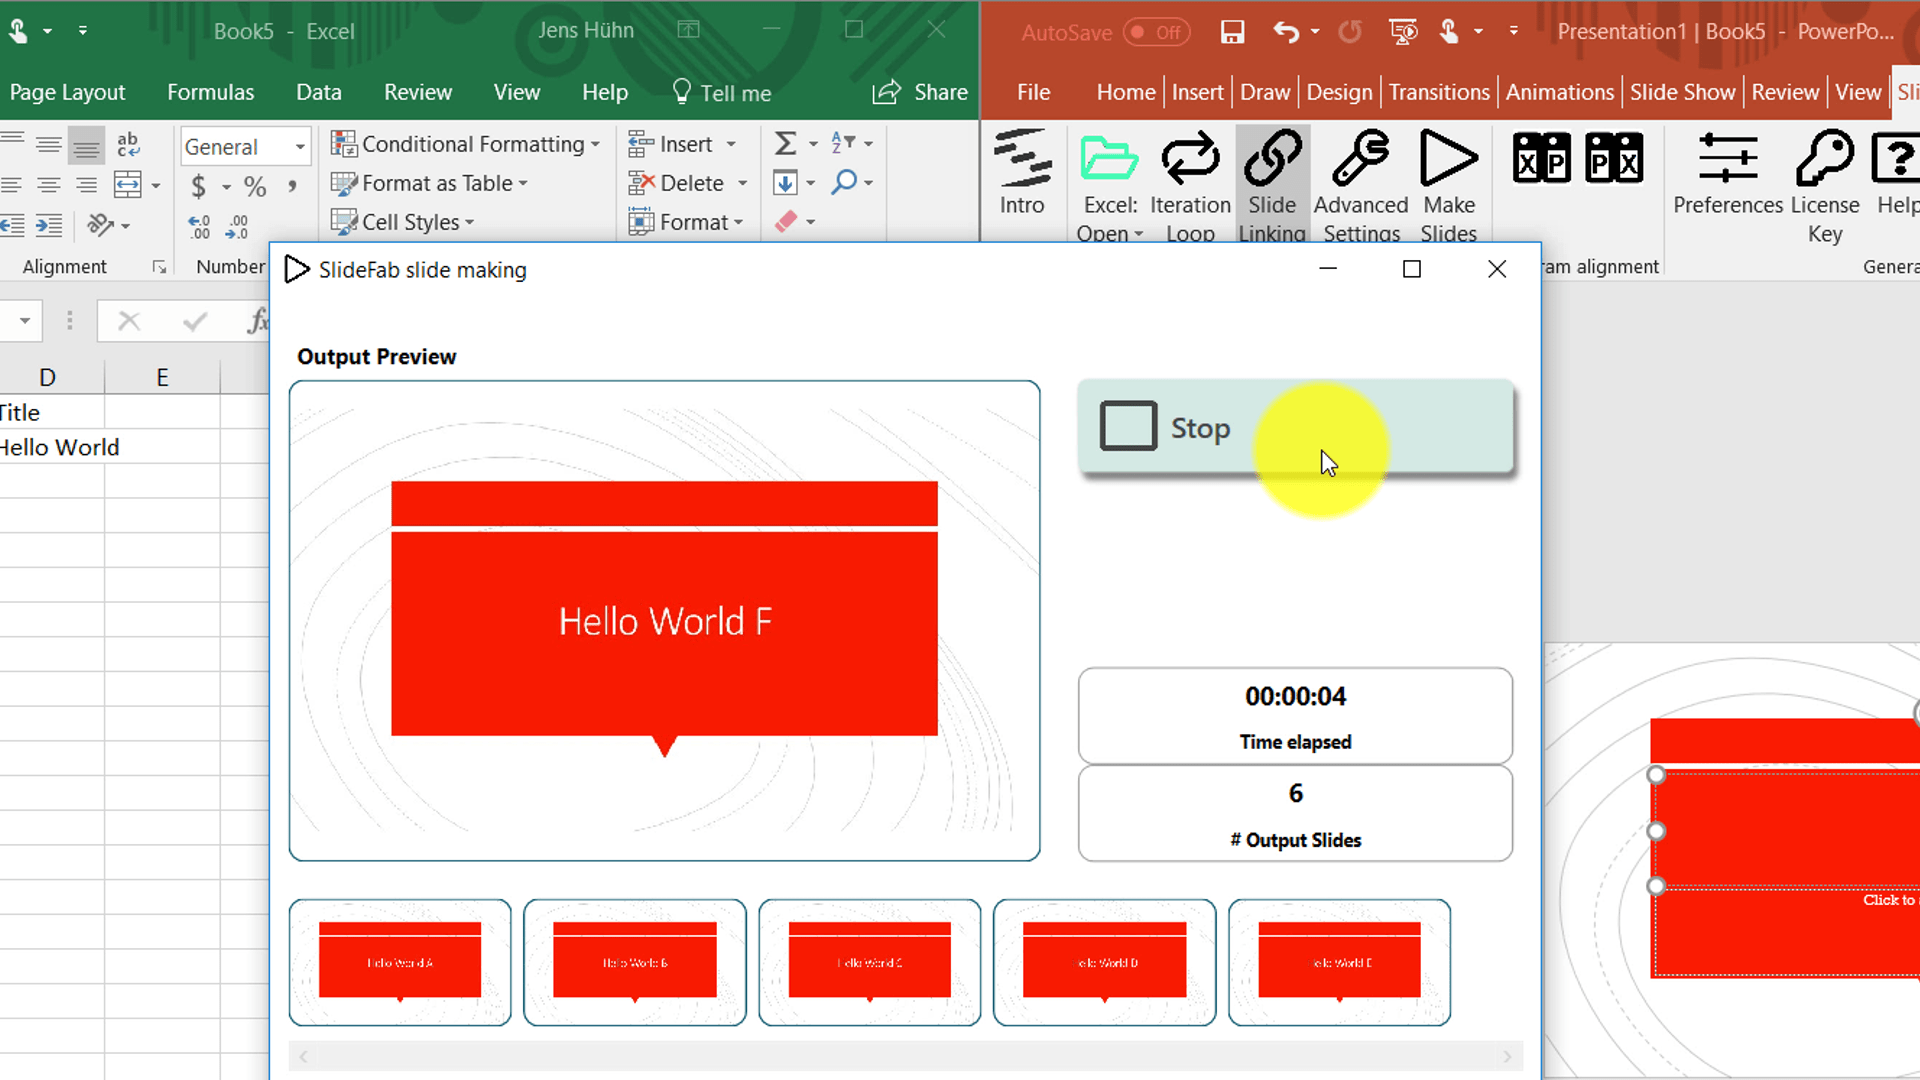
A screenshot from the SlideFab 2 "Hello World" example video

Hello World Example

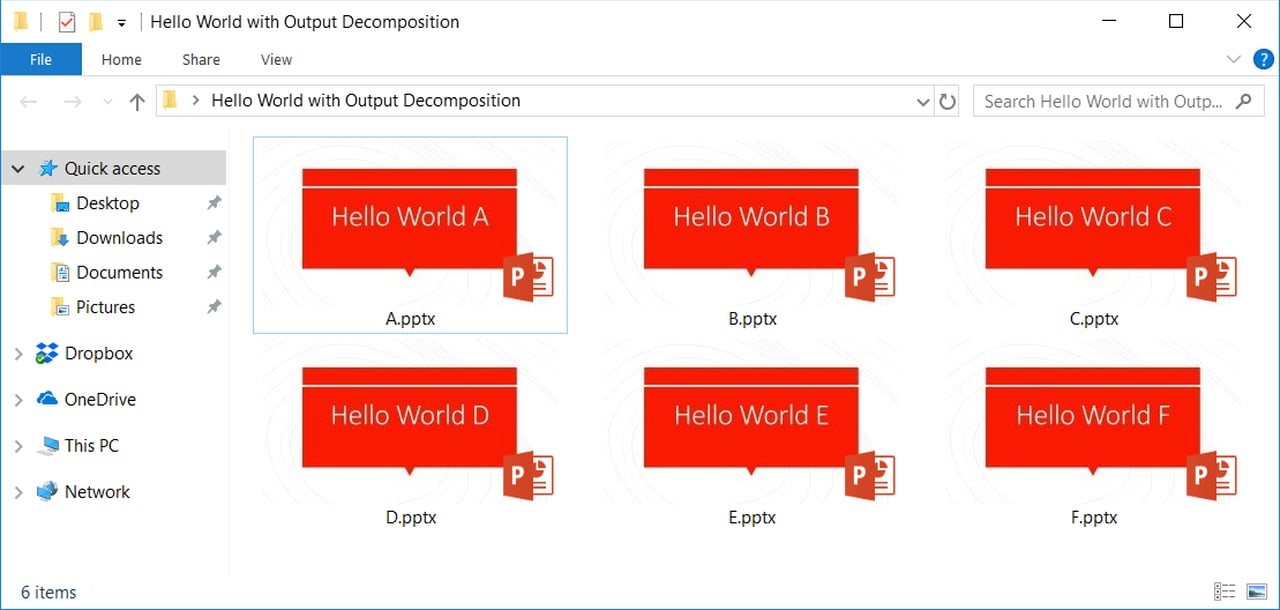
This brief video shows how to create a Hello World project with SlideFab 2. It will be explained how an Excel workbook can be set up and linked with Powerpoint such that multiple slides with different “Hello World” titles are created through SlideFab automatically.

Read More »Hello World Example